Demurrage and Detention: Up, Up and Away
Demurrage and detention charges are rising inexorably. We examine their impact on supply chain costs and how BlueBox can eliminate these costs once...

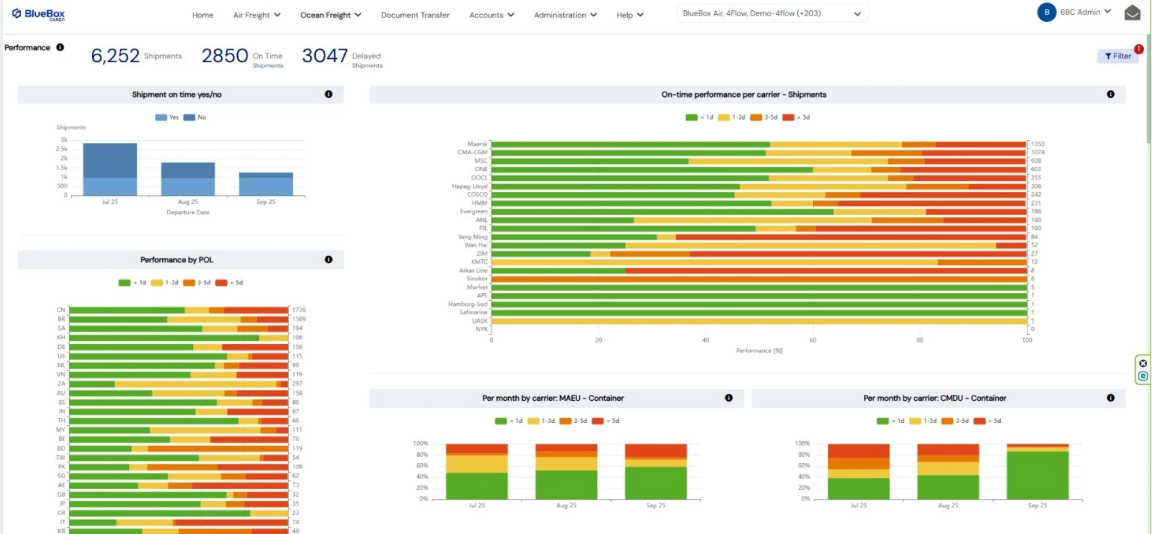
Our comprehensive reporting suite includes export/import volume per mode, period, carrier, and trade lane. These detailed reports help you monitor shipment trends, identify reliable carriers, and optimize utilization. Evaluate on-time performance per carrier to identify the most reliable partners for your shipments and drill down to delays per destination and carrier. With BlueBox, you have the data-driven tools to streamline overall supply chain efficiency and make informed decisions to improve reliability and reduce delays.
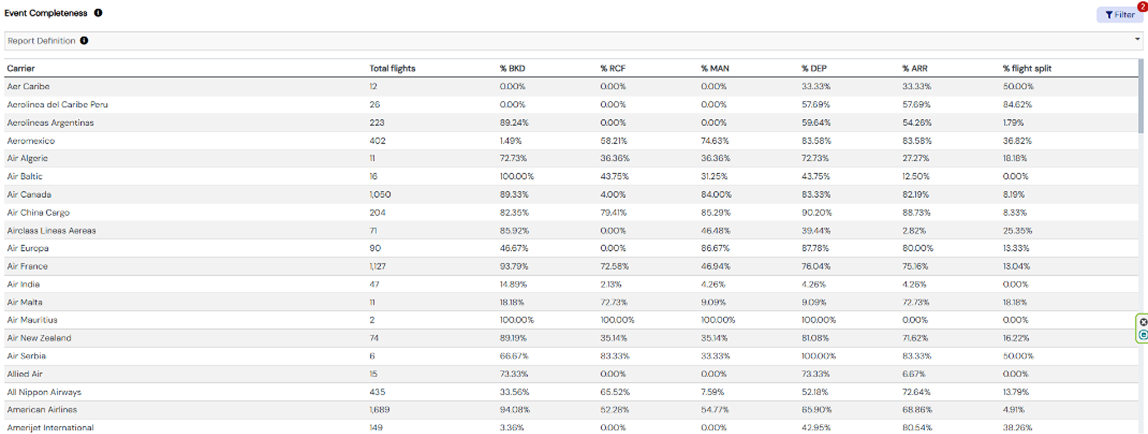
Our data quality reporting enables customers to get ‘under the hood’ and analyse the data produced by air and ocean carriers. We track the average timeliness of data receipt across all events and carriers as well as for each individual event type. Completeness reports show the percentage of masters tracked per carrier as well as the reporting compliance per event. These reports allow customers to evaluate the overall quality of carrier data and inform carrier selection accordingly.
Our comprehensive CO₂ reporting allows users to track emissions per period, trade lane, and carrier, providing not only graphical and downloadable reports but also data-driven insights to enhance mitigation strategies. Based on Ecotransit guidelines, our A-E Eco-Scores enable at-a-glance summaries that indicate whether your emissions are acceptable or problematic. For sustainable supply chain planning, the CO₂ Performance Tool allows you to compare carriers and trade lanes across various factors, helping you make informed, eco-conscious logistics decisions while optimizing efficiency.
.jpg?width=1148&height=501&name=Overlay+Border+Shadow%20(1).jpg)
Our new CO2 forecasting tool enables customers to estimate the CO2 emissions for any shipment weight on any trade lane. It ranks all carriers on the lane in order of their CO2 emissions for both airfreight and oceanfreight. This unique CO2 forecasting tool allows customers to evaluate trade-offs between freight cost and CO2 emissions, enabling forwarders and shippers to comply with Scope CO2 mitigation directives.
.png?width=940&height=426&name=image%20(8).png)
The Lead Time Forecasting report provides origin to destination transit times per carrier based on ALL the actual shipments tracked for both your shipments and all customer shipments tracked. The report provides a far more accurate and reliable view of transit times than carrier schedule information.
.jpg?width=1148&height=530&name=Gradient%20(1).jpg)
Timely, accurate and complete document transfer is essential to ensure timely release of cargo at destination withour D&D penalties. The Document Transfer Report allows customers to measure and manage origin to destination document transfers against shipments. Have all the relevant documents been transferred to destination? Which ones are missing? Have the documents been acknowledged as received and have all documents been received? Have documents been transferred in a timely manner? For customers subscribing to this service, the Document Transfer report provides an invaluable tool for performance improvement.
.jpg?width=1148&height=494&name=Overlay+Border+Shadow%20(3).jpg)
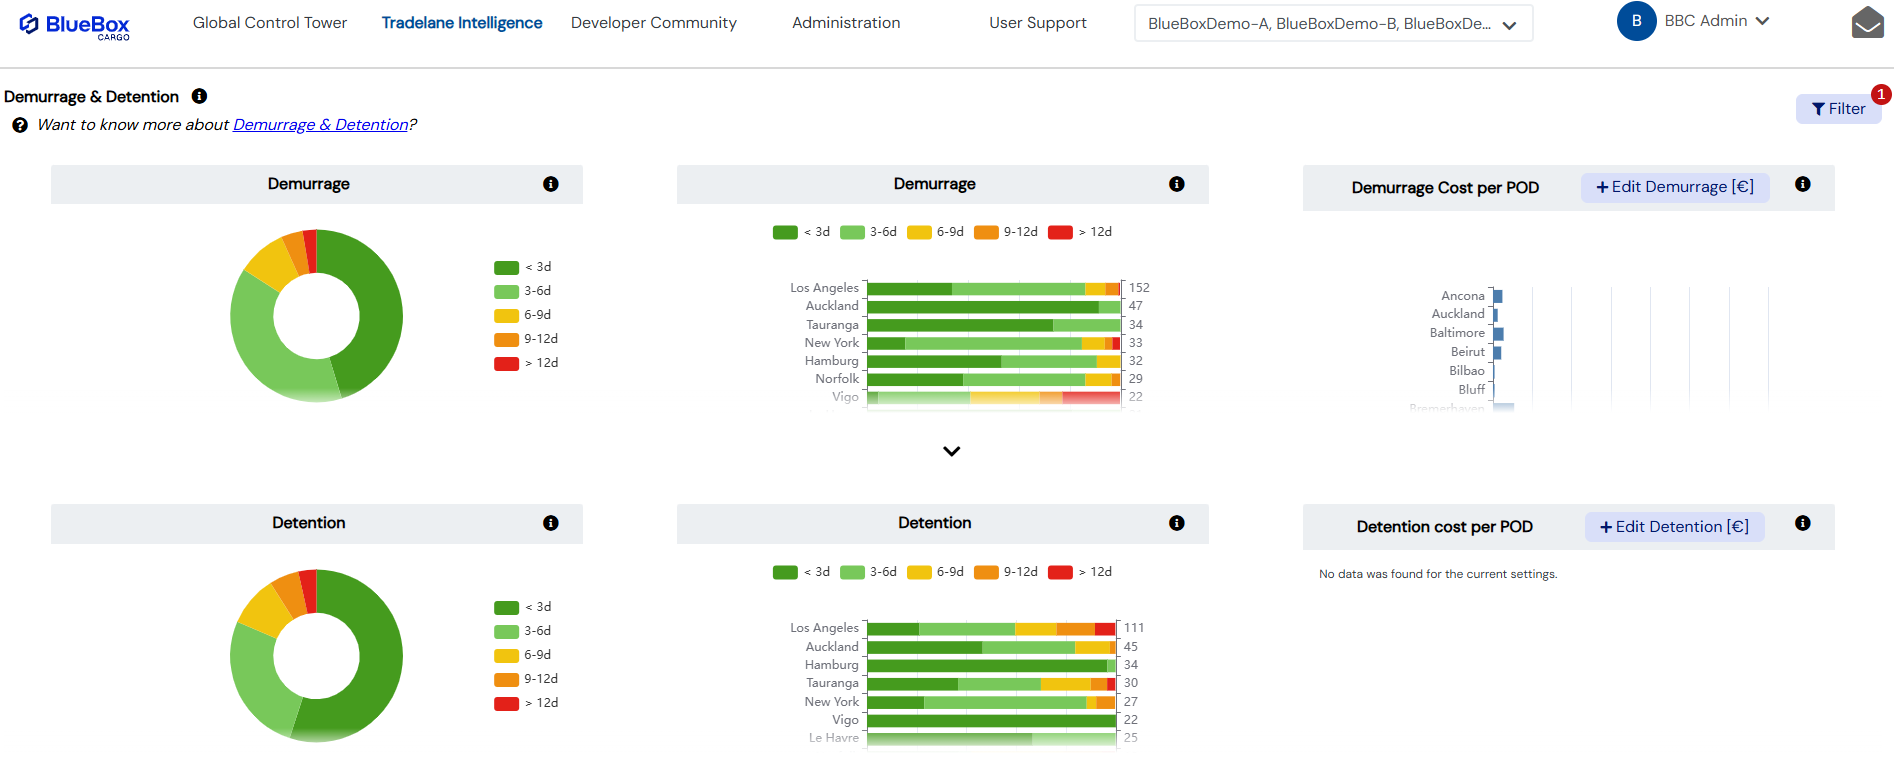
Our new demurrage and detention reporting enables informed analysis of detention and demurrage risks per port and per carrier. How much time is spent in the terminal prior to the release from the CY? How much time elapses prior to empty return? In addition, customers have the ability to input carrier and port specific free times and penalties to highlight exceptions, at risk shipments and estimate penalties for non-compliance. With Global D&D charges up over 100% over the last 12 months and average charges of over $800 per container – mitigating D&D penalties has never been more important.
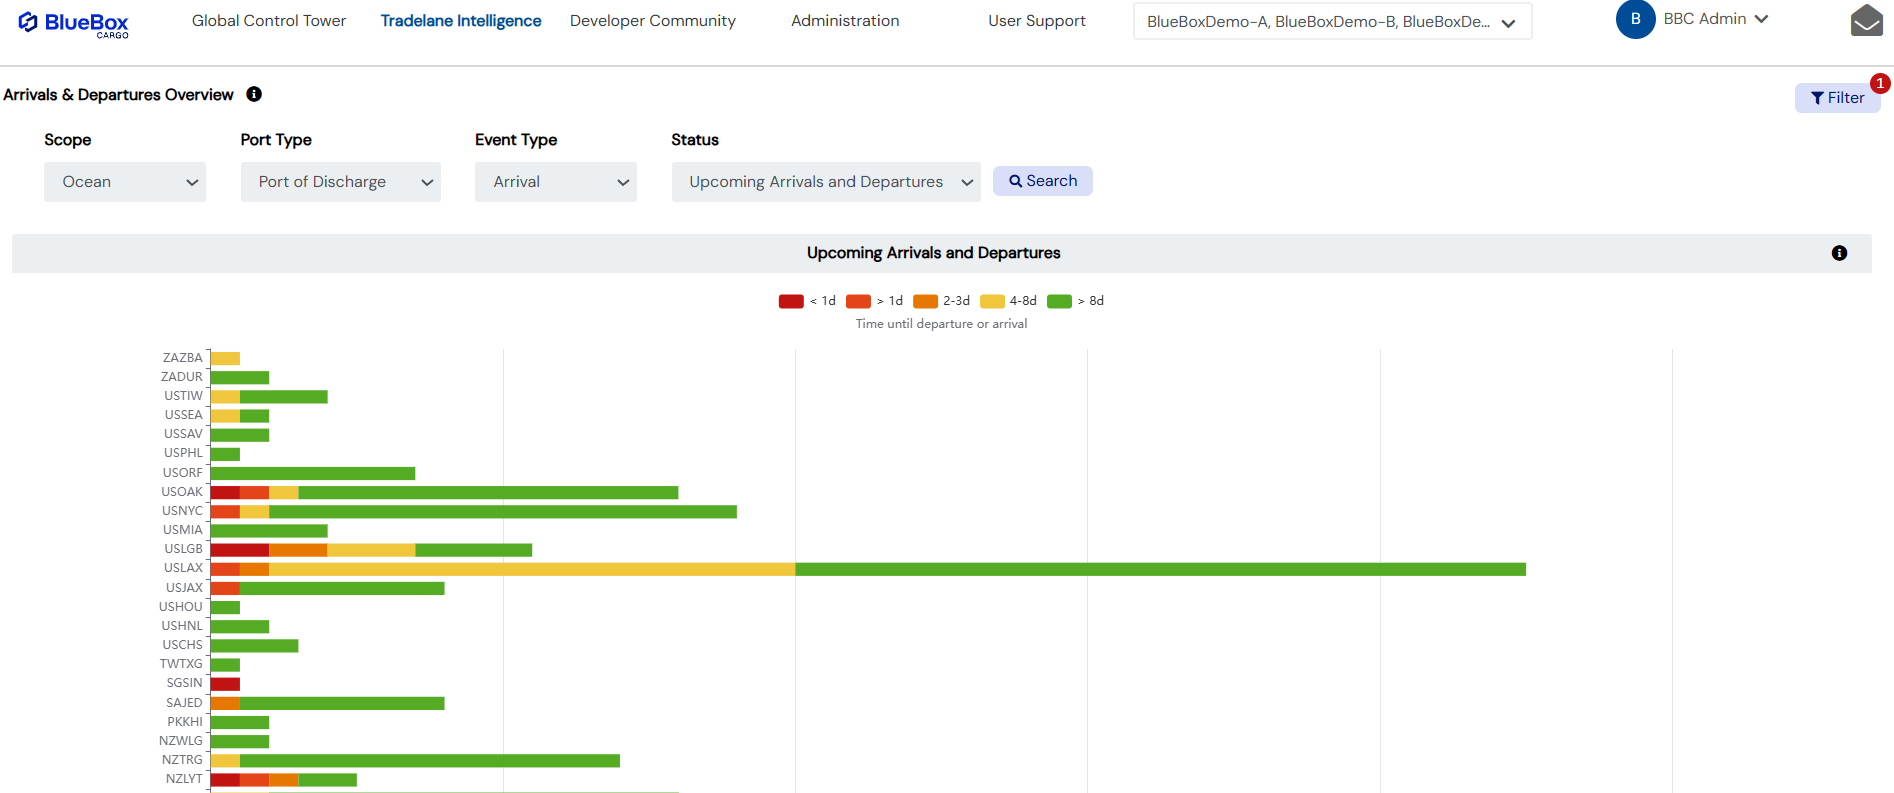
Our new Arrivals Planning feature allows users to view shipments by arrival day over the next 1-7 days by origin port and drill down directly to view the shipments concerned. Supported by industry leading Predicted ETAs updated by AIS positioning, this enables inbound operations to effectively plan clearances, container haulage, warehouse-in schedules and staff allocations reliably.
%20(1)%20(1).png?width=200&height=279&name=image%20(29)%20(1)%20(1).png "image (29) (1) (1)")

%20(1).png)