
Advanced Data-Driven Supply Chains
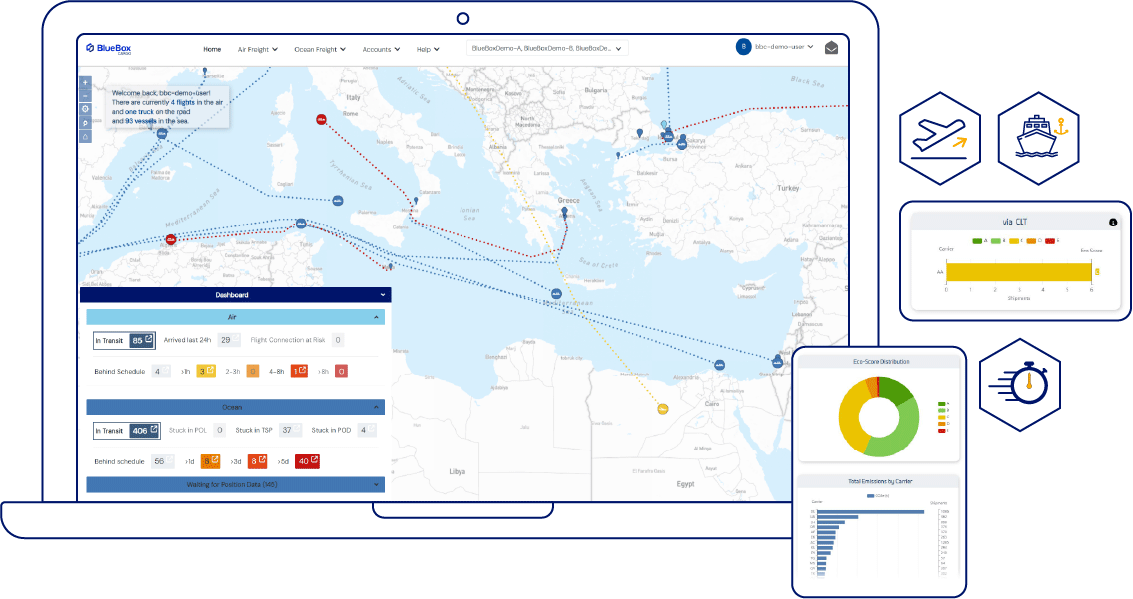
The BlueBox Cargo shipment tracking platform enables real time shipment and inventory visibility for all global oceanfreight and airfreight shipments. Proactively manage disruptions, reduce operational risk, streamline processes, improve productivity and delight customers with our clean, intuitive and customizable user interface.

Immediate
Insights
Customizable homepage overview of all global shipments with at risk, behind schedule shipments highlighted and one click to detail view

Comprehensive Carrier Coverage
We gather data from over 50 ocean carriers and 150 airlines covering 99% of global ocean and air shipments.

Advanced
Algorithms
We ingest data from multiple sources – carriers, wholesale channels, port terminals and AIS –and apply our own advanced algorithms to provide the most accurate event updates and predictive ETAs.

Collaborative
UI
Unlimited internal users. Share shipment data easily by clicking a shipment OR grant 3rd parties access to their shipments. Share comments and documents.

Decision-Making
Tools
Customizable and downloadable reports to measure performance, improve accountability and drive better decision making.

-2.jpeg?width=1600&height=756&name=WhatsApp%20Image%202025-09-26%20at%2010.25.06%20PM%20(4)-2.jpeg)
.jpeg?width=1600&height=745&name=WhatsApp%20Image%202025-09-26%20at%2010.25.06%20PM%20(3).jpeg)
.jpeg?width=1600&height=700&name=WhatsApp%20Image%202025-09-26%20at%2010.25.07%20PM%20(1).jpeg)
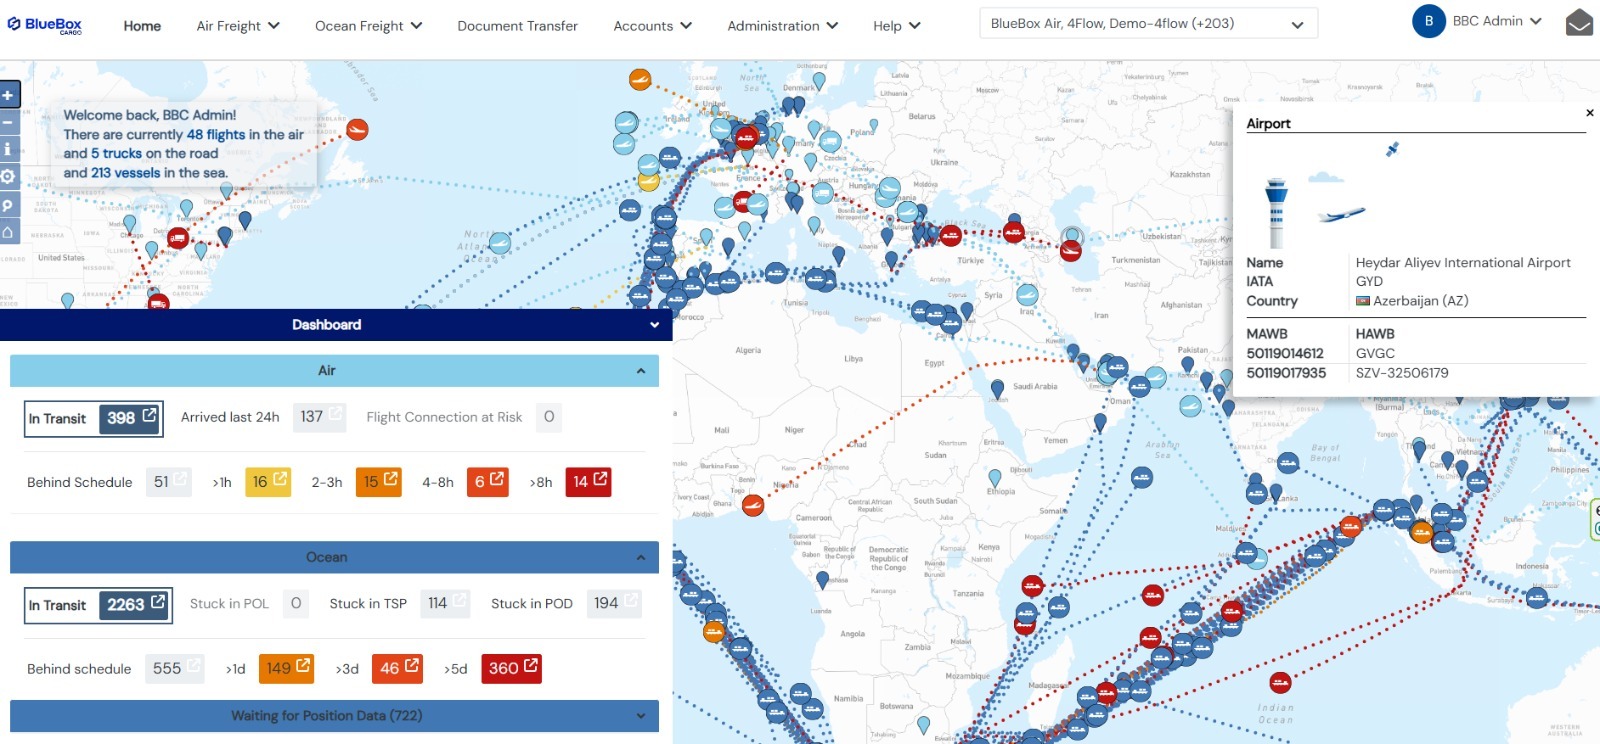
The BlueBox homepage features a customizable world map showing all air and ocean shipments with their AIS position. Click on any ship/plane icon for a quick summary of Master-House-Voyage-Lane and on time/delay status. In the bottom left corner is a minimized dashboard summary.
Now you see the same screen but with the dashboard view. Our dashboard displays everything you need to know- in transit summary, recent arrivals, behind schedule ( set your own alert timeframes), at risk and waiting for data shipment summaries.
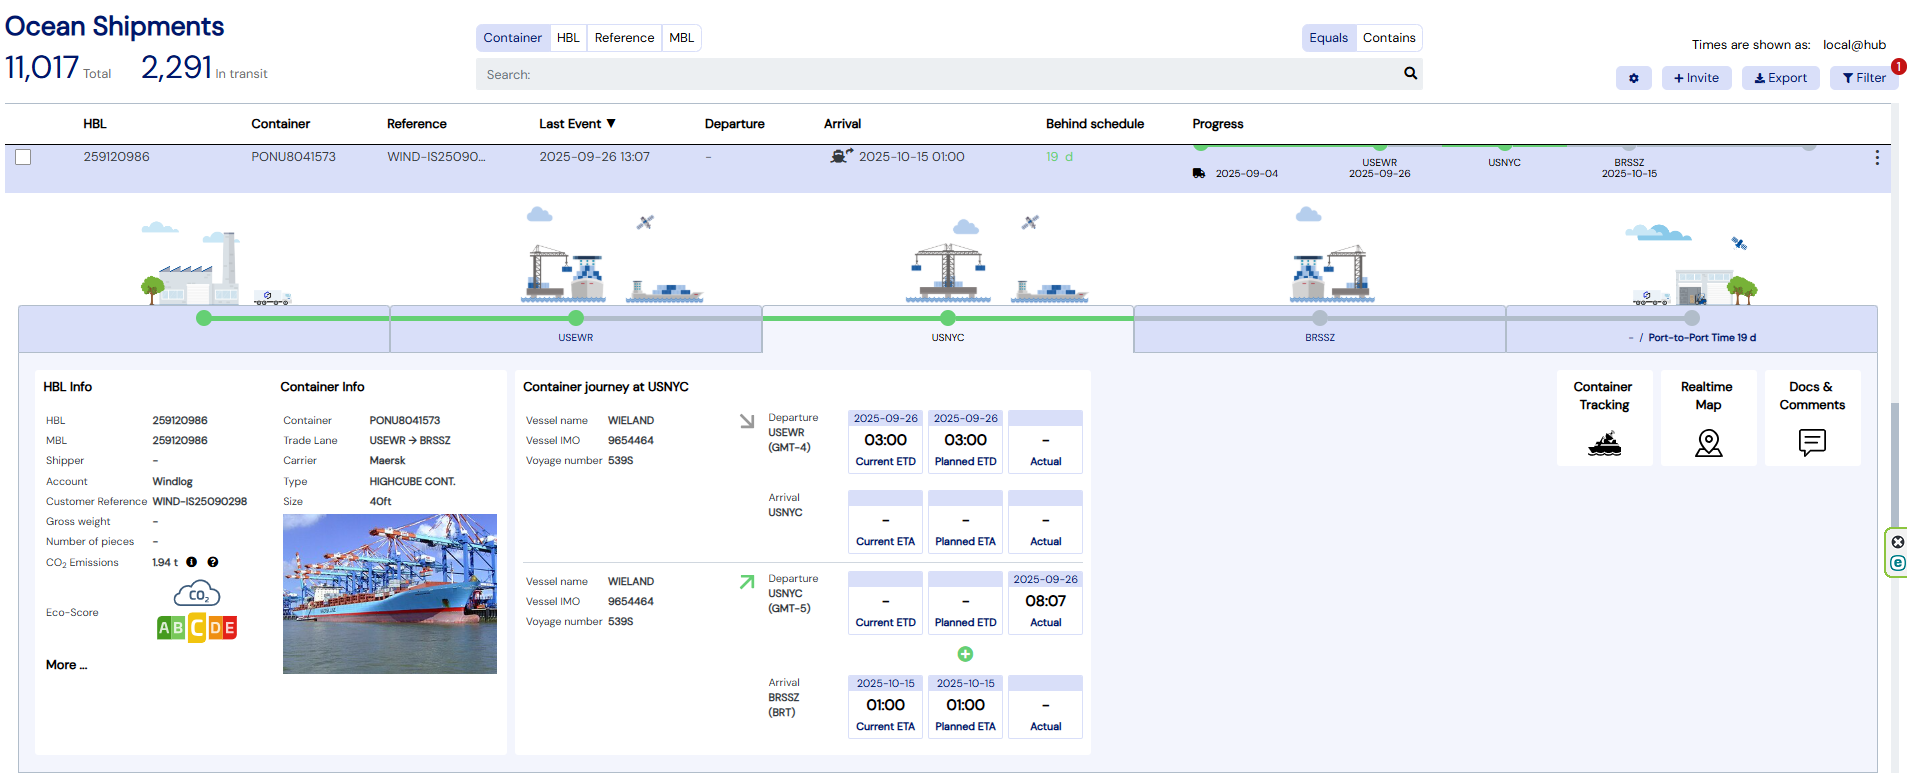
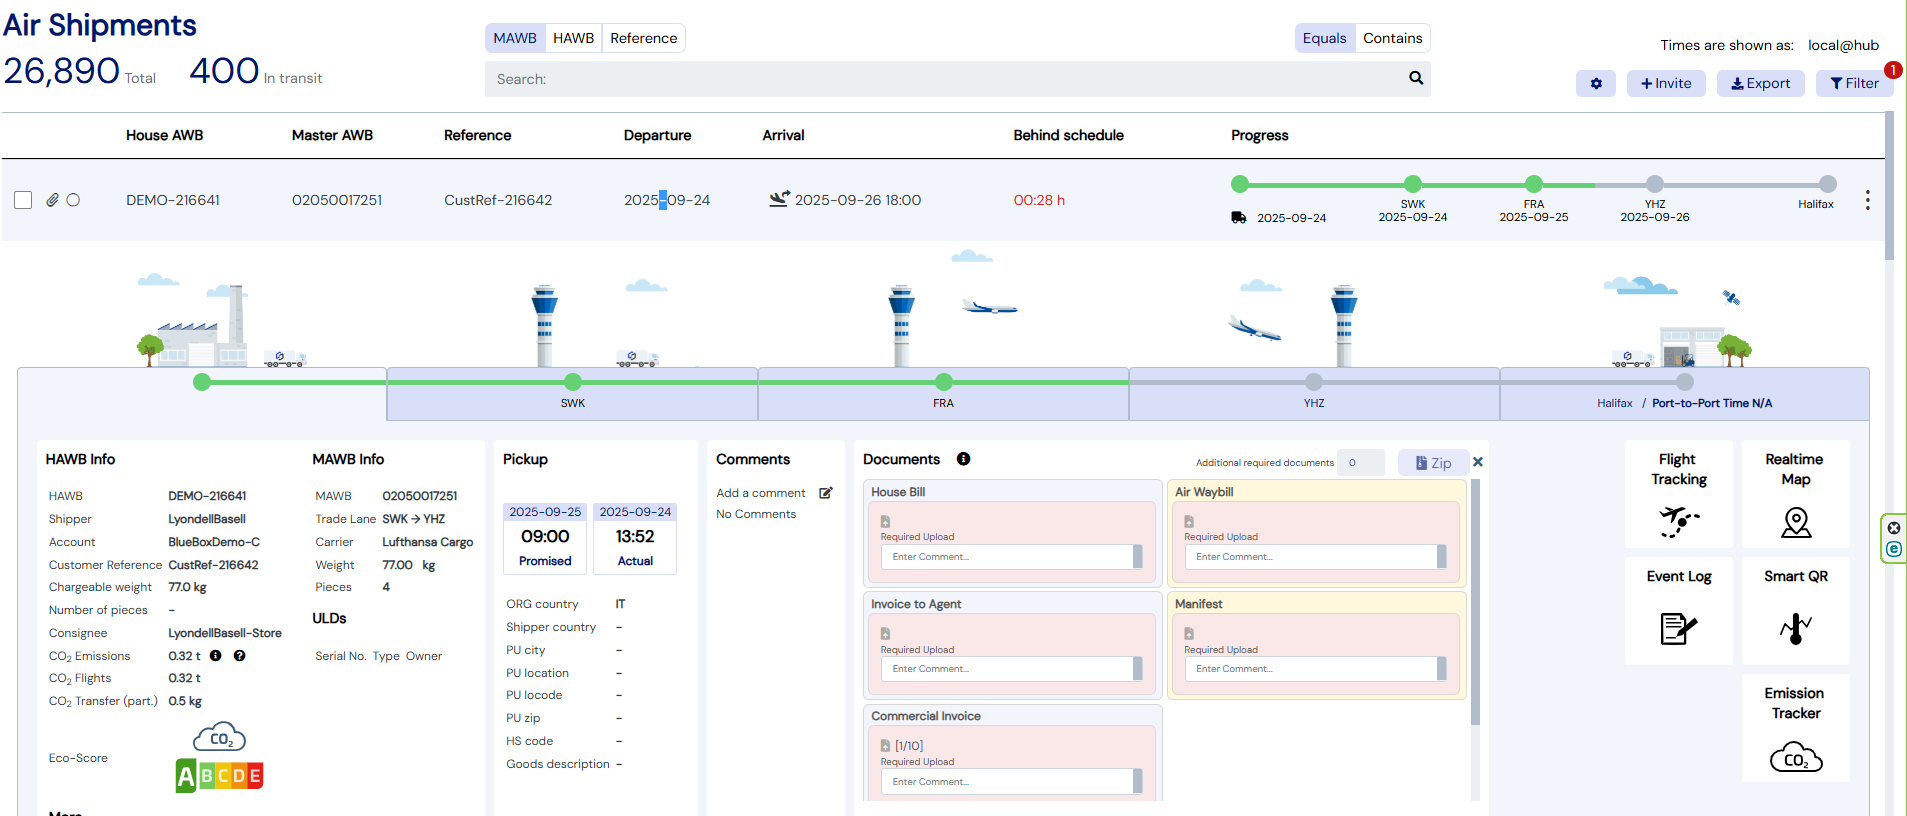
The list view shows all shipments with key data including carrier and customer references, clear shipment progress timelines, departure and arrival times, last event update and whether the shipment is on time or behind schedule. Change the column order, filter and sort or invite customers to view. Click on any shipment for a detailed shipment view.
The shipment view displays granular tracking information. Planned and actual events – including transshipment ports - and the latest on time / behind schedule status. Links to realtime maps and carrier tracking websites. Enriched with your system data, shipment documents and user comments. Share easily with customers and 3rd parties.
Our comprehensive reporting suite includes export/import volume per mode, period, carrier and trade lane. These detailed reports help you monitor shipment trends, identify reliable carriers, and optimize utilization. Evaluate on-time performance per carrier to identify the most reliable partners for your shipments and drill down to delays per destination and carrier. With BlueBox, you have the data-driven tools to streamline overall supply chain efficiency and make informed decisions to improve reliability and reduce delays.
BlueBox provides best in class CO2 emissions reporting calculated based on the specific vessel/aircraft type used, not just average emissions per route The Eco-Score gives you a transparent view of the environmental impact of your chosen route. For sustainable supply chain planning, the CO2e Performance Tool allows you to compare carriers and trade lanes across various factors, helping you make informed, eco-conscious logistics decisions while optimizing efficiency.

DESIGNED FOR PRODUCTIVITY
A seamless user experience enhanced by powerful features
BlueBoxCargo offers a wide range of functions that simplify and streamline day-to-day shipment tracking work and makes it easy to surface and solve supply chain problems. Tracking costs are easily offset by improving staff productivity and so all our functionality is focused on supporting users to do more with less. BlueBox makes tracking simple and reliable. .

SPLIT SHIPMENTS
16% of all airfreight shipments are split at transshipment hubs and carrier tracking is hard to navigate. BlueBox provides clear summaries of split shipment transits.

PREDICTIVE ETAS
BlueBox continually updates predicted ETAs based on cross referencing historical data with AIS data. We are the only company to track airfreight / aircraft via satellite.

DOCUMENT ENRICHMENT
Upload shipping documents, commercial documents, claim reports and invoices and share internally and externally

EXCEPTION ALERTS
Generate and escalate exception alert emails to key stakeholders based on the behind schedule parameters on the dashboard.

CO2 FORECASTING
Estimate CO2 emissions for different airfreight routings to effectively balance cost vs emissions. Ideal for EU Scope 3 emissions mitigation strategies.
PERSONALIZATION
From the ability to customize dashboards and maps to reordering columns and setting filter and sort options – everything can be tailored for a personal user experience.

REPORT AND EXPORT
Comprehensive performance, event compliance and CO2 reports – all available for excel download.

CUSTOMIZATION
BlueBox is committed to improving our service offering and user interface and we do so in conversation with customers. Let us know what you need. We are agile and dynamic.